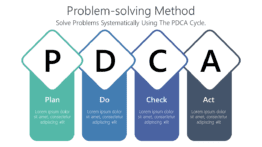
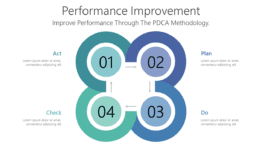
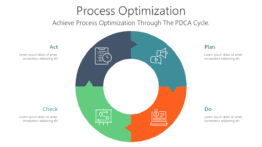
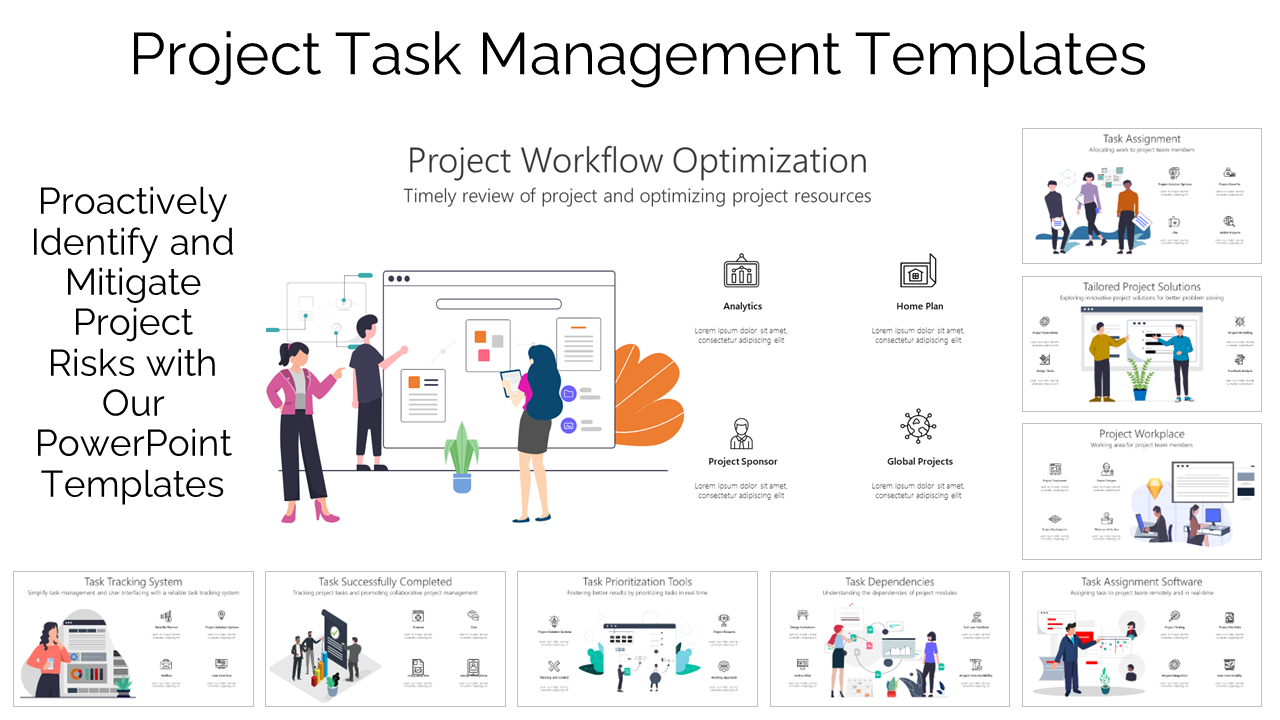
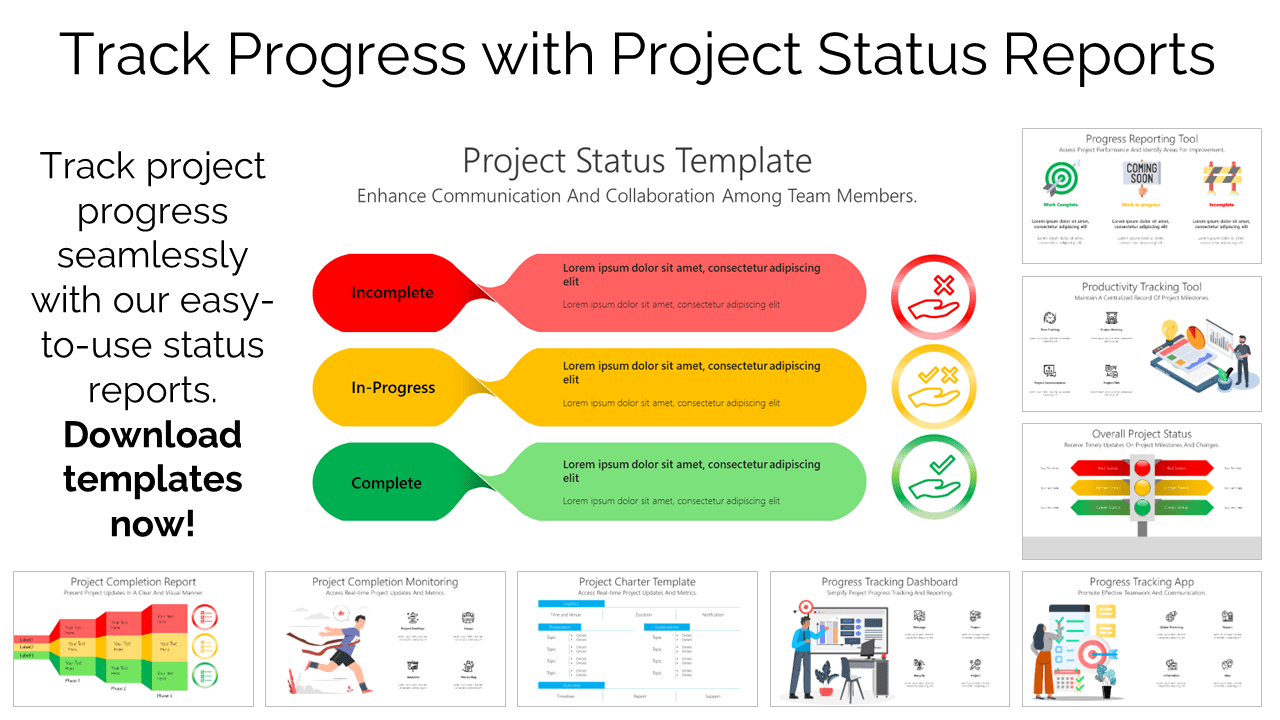
Looking for a way to communicate your project frameworks in a clear and concise way? Project frameworks infographics in PowerPoint are the perfect solution! These visual representations of data can help you to increase understanding, improve communication, and boost motivation.
Our category of project frameworks infographics in PowerPoint includes a variety of designs that can be customized to meet your specific needs. Whether you’re looking for an infographic to explain your project framework, track your team’s progress, or highlight key successes, we have the perfect solution for you.
Our infographics are also SEO-friendly, so you can be sure that your content will be found by potential customers and partners. With our help, you can visualize your success and achieve your project goals.


