

Sale!

PowerPoint Template for Visualizing Break-Even Graphs
Visualizing Break-Even Graphs is essential for understanding profitability and business stability. This PowerPoint template for profit analysis allows users to create professional presentations with interactive break-even point slides, making it easier to visualize break-even graphs and conduct effective break-even analysis.
Original price was: $1.00.$0.50Current price is: $0.50.
Craft engaging visuals and compelling presentations with PowerPoint Template for Visualizing Break-Even Graphs. This high-quality slide deck is crafted for seamless storytelling and is best suited for educational workshops, training materials, and knowledge sharing. Ideal for professionals seeking a balance of aesthetics and functionality.
Only logged in customers who have purchased this product may leave a review.
Related products
Warning: Undefined array key "pages" in /home/u187038440/domains/pptinfographics.com/public_html/wp-content/themes/flatsome-child/woocommerce/single-product/related.php on line 66
Sale!

Profit Analysis
Workflow Automation for Profits PowerPoint Template Download
Original price was: $1.00.$0.50Current price is: $0.50.
Sale!

Original price was: $1.00.$0.50Current price is: $0.50.
Sale!

Profit Analysis
Original price was: $1.00.$0.50Current price is: $0.50.
Sale!

Original price was: $1.00.$0.50Current price is: $0.50.
Sale!

Original price was: $1.00.$0.50Current price is: $0.50.
Sale!

Profit Analysis
Original price was: $1.00.$0.50Current price is: $0.50.
Sale!

Original price was: $1.00.$0.50Current price is: $0.50.
Sale!

Original price was: $1.00.$0.50Current price is: $0.50.
Sale!

Original price was: $1.00.$0.50Current price is: $0.50.
Sale!

Original price was: $1.00.$0.50Current price is: $0.50.
Sale!

Original price was: $1.00.$0.50Current price is: $0.50.
Sale!

Original price was: $1.00.$0.50Current price is: $0.50.
Sale!
Profit Analysis
Workflow Automation for Profits PowerPoint Template Download
Original price was: $1.00.$0.50Current price is: $0.50.
Sale!
Original price was: $1.00.$0.50Current price is: $0.50.
Sale!
Original price was: $1.00.$0.50Current price is: $0.50.
Sale!
Original price was: $1.00.$0.50Current price is: $0.50.
You may also like…
Sale!


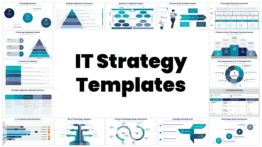
Strategy Infographics
Original price was: $6.99.$3.99Current price is: $3.99.
Sale!


Sale!

Mega Deals
Original price was: $69.99.$39.99Current price is: $39.99.
Sale!

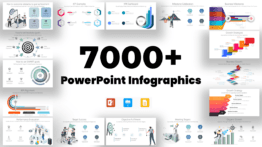
RELATED INFOGRAPHICS COLLECTIONS


Sale!

Point Infographics
Original price was: $1.99.$1.00Current price is: $1.00.


Reviews
There are no reviews yet.